Wednesday, December 19, 2007

Friday, December 14, 2007

Week 16 = 12/14/07

Today was our last day of class. Finishing up the final project and taking our last test was the plan for me but due to a major mistake on my part I was not in class today. I have not finished the final project and I may not have many options remaining. My only option right now is to finish it up this weekend and talk to the instructor on Monday. Tuesday I thought I was gonna do option two on the final project but that didn't happen due to lack of data from my source. As a result of this I am doing option two. This also might be my last blog for this site. If it is then I have enjoyed this class and making these maps for the blog site. I would like to learn more about GIS and take the next GIS class but I have to pass this class first and finish out my other class before I can even think about taking the next GIS class.

Friday, December 7, 2007

Week 14 = 12/07/07

Today was last class to work on our projects as well as get any last minute help or advice. Next class is when everything is due. The final project, a test on two chapters, and a one page summary on chapter fourteen is what is coming up next class. Due to a web design project I am doing, I was not able to attend class today. For the final project there was two options given. Option one has a scenario given but option two allows us to choose a scenario. I thought of doing option two but the idea I had didn't hold water due to the time and lack of data that was available to me. So in light of this I have decided to do option one. For a complete list of the options link to the GIS home page. I plan to be working on the GIS project for the next week as well as studying for the final test. I am confident that I will be able to complete the assignments, pass the test, and pass the course.

Thursday, December 6, 2007

Week 13 = 11/16/07


This map is the final product of our lab quiz. This map shows some buffered layers for Buncombe County. If you look hard enough you can see a layer for I-26, I-40, and parcels that are over 100 acres.

Week 15 = 11/30/07


This map is the finished product of our lab exercise today. As you may or may not could see this map has some buffered layers for Henderson County. This particular map shows some criteria that the city has added when trying to decide on a place for a new landfill.

Saturday, December 1, 2007

Week 15 = 11/30/07

Today was our third test for the semester. The schedule indicates that we need to have one more test but due only two more classes that is going to be pushing it. After everyone finished the test we had ourselves another lab exercise. This lab exercise was to test our knowlege on how to use a set of buffers on a simulated project for Henderson County. I will admit that this project was kinda hard for me but with the help from Pete I was able to finish the project. Below is a screenshot of the lab exercise as well as the information about the screenshot.

This is the screenshot of the lab exercise in ArcMap. As you can see, or may not see, this image shows all the layers that are used in the map. This image was taking before I added a title and exported the map to a jpeg for printing. The map shows some areas to help Henderson County decide on a location to build a new landfill.

Friday, November 23, 2007

Week 14 = 11/23/07

We did not have class today due to the Thanksgiving Holiday. Thanksgiving was yesterday and AB Tech is closed the day before, the day of, and the day after Thanksgiving. This is a plus for me as it will give me and chance to study for the test next class period.

Friday, November 16, 2007

Week 13 = 11/16/07

Today in class we did a online lab exercise that was created in another GIS class but was modified for our class. To view the lab exercise just click on the following words: Lab Exercise. The lab exercise is designed to test our skills with the ArcGIS software. If you look four posts above this you will see the map for this exercise. The question that you might be asking yourself now is "What happens if you come to a step in the exercise that you don't remember how to do?" The answer is that we have to either look back in the ArcGIS software book and/or go to the ESRI support page and find the answer in the online sections. During the lab the only parts that took long was downloading the parcels data from the Buncombe County site and exporting all my shape files from ArcMap into my Geodatabase. The downloading and the exporting took about thirty to forty minutes for each. Before the lab the instructor informed us that we were going to have a test the next time the class meets which will be on November 30th. I do look forward to the extra time to study due to me not doing so well on the previous two tests.

Friday, November 9, 2007

Week 12 = 11/09/07

Today was the GIS day that has been advertised and talked about for a couple of weeks now. To say the least the event was full of activity. The day prior to the GIS day had its share of activity. That was the day that the equipment came in for the geo dome that was going to be setup and the AB Tech staff and I got the hallways and classrooms ready to receive the students and guests. I was able to play with the Garmin GPS units the Thursday before today so that when someone wanted to see them in action I was the dude to demo it. Some questions I was able to answer and some I had no clue as to the answer. Those questions I didn't know I would sent the person asking the questions to Pete and told the person asking the question that he was the "man" at answering any GPS question. One person asked me how she could use the GPS unit in her car or taking a trip. Another person asked me how he could use the GPS unit on a hike that he was planning to take. As the crowds thinned out during the course of the day I went over to the geo dome that was setup. This person that was doing the demo for the dome had a picture of Mars, Earth, and even our solar system. I wasn't able to catch all of the lecture but the part I did hear was that NASA is teaming up with the company that made the demo to get a better mapping software ready for use in NASA and in the civilian world. I could go on and on with the numerous people I have met and the activities I have seen but I won't. All I can say is that today was a day that can never happen the same way again. The next GIS day might have more presentations or more people at it but it will never be like the first ever GIS day at AB Tech that all of my instructors and my fellow classmates helped be a part of.

Friday, November 2, 2007

Week 11 = 11/02/07

Today for class we had a activity day, so to speak. We got to play with some GPS units that AB Tech has managed to acquire. Before we got play with the GPS units we discussed some topics like what GPS system OnStar uses for commerical use. We also discussed more and more about the GIS day which is going to be next class period. After the discussion we took the GPS units and went outside. We acquired the satellites and then marked a wave point at the light pole that is facing the Balsam building. Then we decided to mark another wave point at the oak tree that is at the beginning of the drive for the nursing building and the balsam building when you are coming down Victoria Rd. After a couple of passes going back and forth between those points we decided to make another wave point. This wave point was located at a light pole in the parking lot for the Birch building. When we got finished with the wave points we went back inside and saw how to download the data from the GPS unit to ArcMap, Google Earth, and ArcCatalog. We were shown how to make several different maps and reports from those three wave points. We were also exposed to several different web sites that contain all kinds of maps and reports about GIS. Some of the sites allowed us to convert data to a .kml file for goggle earth. While we were outside there were talks about setting up a booth for dudes to take a GPS unit and try to navigate to some points around AB Tech. I kinda am looking foward to being outside and help some people learn how to use a GPS unit. I am going to have get with the instructor sometime next week so I can learn more about the software and the GPS unit.

Friday, October 26, 2007

Week 10 = 10/26/07 = Cherokee County Maps


The map on the left shows the Cherokee County with the aspect option of the ArcMap software. The map on the right shows the hillshade of the entire county. The different colors indicate the different hillshades for the county. Of hand I am not sure what the colors mean but if you would like to know then shot me a comment and I will get a legend on that map.


The map on the right shows a contour for the Cherokee County. This map was generated by taking the downloaded data and using the contour option in the ArcMap software. The map on the left displays the cut/fill for the entire county. The blue represents the net loss for the county. It is hard to tell but there is another color on the blue map. Pop quiz hotshot, can you tell me the other color?


The map on the left shows the hours of winter solstice for the Cherokee county. You aren't able to see it but the hillshade layer is underneath this layer. If you look real close you can kinda see it. This map does not show any title or legend on it. The map on the right shows the final version of the map on the right. This map has a title, legend, and miles chart. The map on the left is ready to be printed and used.

Week 10 = 10/26/07

Today in class we went over our second test that we had. On the parts that I thought I did good on I did bad on but the parts that I thought I did bad on I did good on. Needless to say I am not going to post my grade on this blog site. After reviewing the test we got a demonstration on how to create a slope, hillshade, contour, and several other different maps. We were even shown how to download the hours of sunlight from any county in Western Carolina. After the show we were assigned to "play around" with the software for the remainder of the class. I decided since my grandma and two uncles live and work in the Cherokee county area I would do all of my maps for that county. The maps that should be displayed above this blog are the contour, cut/fill, aspect, and hillside maps. The hillside map may not be on the blog because I may not have saved just that map. I was trying to do the viewshade map for the hours of winter and summer solstice. Since the computer was taking a long time to calculate these maps I decided to abort those maps. When I tried the winter solstice calculation I got an error message about six minutes in it. During our lab time we were shown how to save a layer with our maps in that layer and we got more info on the GIS day. It turns out that our class is going to be broken up on that day. The instructor would like some classmates come from 8am-noon, some to come from 10am-2pm, and some to come the times between 8am-2pm. What I am going to do is report in from 8am-2pm since this is the first GIS that I have ever been to. I also heard that pizza is going to be served for our class. I only hope that there is enough pizza for the entrie class since most of my classmates like pizza.

Friday, October 19, 2007

Week 9 = 10/19/07 = Spatial Exercises Map


This map shows the suitable locations for areas for a new school based on some conditions that were established in the calculations. These highlighted areas are away from existing schools and close to recreation sites. Due to the small size of the map it might be hard to tell that right now. If you would like me to display the calculations for displaying this then post a comment and I will display that image.

Week 9 = 10/19/07 = Chapter 12 Maps


The map on the right shows an area in which the trees are not able to be cut down and logging is prohibited. The map on the left shows both areas that are and are not able to be cut down. In theory these maps will be used to help logging companies. If you would like me to enlarge the images then post a comment and I will try to post the larger image.

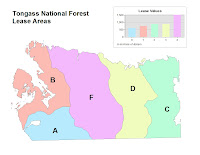
This map shows the harvestable areas that have a query that was created to display just that area. The map didn't display all the way when I up loaded it. At the top where it looks like there should be circles is where there are circles that the query had produced. If yall would like me to display the circles then post a comment and I will hope for the best

Week 9 = 10/19/07

Today in class was a break in the normal flow of the class. The normal flow is we come in lecture on one or two chapters and then do some lab exercises with the remaining time. With the normal flow I usually have little to zero troubles after I get started. Today was not a normal day. When we came in we were able to finish our lab exercises from the previous class. For me I had already done chapters eight and nine and all I had to do was chapter tweleve. Not only was I able to finish chapter twelve but I was able to export some maps that I had done from the second and third week of class to a jpeg. Needless to say that those images are finally on the blog. After two and a half hours of lab the instructor started to demonstrate how to download files from the Buncombe County website. The link to the site should be located on the left side of the blog site. During the demonstration we started to lecture on chapter ten, raster analysis, because some the data from the county was raster based data. After about a hour of the lecture we were given an exercise from the instructor on finding a site for a new school in the stowe geodatabase. When I went over to my lab computer and moved the mouse to get it out of the screen saver something weird happened. The mouse pointer displayed by the rest of the screen was black. My fellow classmates and I tried several options like "ctrl + alt + del" and hitting any key on the keyboard. In the end I had to reboot the computer. Think goodness I had saved my data before we started the lecture. After the computer powered back on I started on the exercise. During step one the instructor informed me that it would be better in the long run to store the spatial data folder on the root of my flash drive instead of in my gis folder due to there being a space in my gis folder. After getting through the computer reboot and the step one error everything else went smooth. I was able to finish the lab exercises in plenty of time and exporting the maps went smooth as well. Above this blog should be the maps for chapter twelve and the spatial analysis exercise.

Week 3 = 09/07/07 = Chapter 13 Maps


This map shows three different projected coordinate systems. All of the data frames are using the Albers Equal Area Conci projection but each data frame has a different coordinate system that defines it. This small of a map might be hard to read. If it is then click on the image itself to kinda get a better view. If you would like me to make the image bigger then post a comment about it and I will see what I can do.

This map shows which states have had the most growth between 1990 and 2000. It is kinda hard to see this map. I think if you click on the image itself it will display the map be itself and you might could see it better. If not, then post a comment about it and I will see what I can do.

Thursday, October 18, 2007

Week 7 = 10/05/07 = Chapter 9 Maps & Tables


This map shows a selection of metals pits that are most hazardous and the type of clean up for the pits. The different colored dots indicate the type of clean up. To be honest, I have no idea what type of clean up the colors mean. When I was exporting this image I forgot to make a image that defines what the colors stand for. For anyone looking at this map and want to know what the colors mean then post a comment on here and I will see what I can do.


This map shows a map that has three selected abandoned pits that are within a half mile of the Mississippi River. All three selected pits have had there tables appended to make one table or report for them.

Week 7 = 10/05/07 = Chapter 8 Maps & Tables


This map shows a selected parcel that is up for sale from about two dozen or more parcels. The table to the right of the map shows the attributes (asking price, zip code, address, etc..). If you are having trouble making out any of the maps, then post a comment on the blog and I will see what I can do.

The map of the left shows a group of parcels that are up for sale and that have a asking sale price of less than one hundred-seventy thousand. The table to the right of the map shows the attributes for the selected parcels in the map.

This report displays the sale price, how many square feet, and how many bedrooms each parcel has that is up for sale. I wonder if the company that owns them are able to do a monthly payment plan.

Friday, October 12, 2007

Week 8 = 10/12/07 = Chapter 11 Maps


The tan colored map shows a section that has been aggregated into five lease polygons and the letter map makes it easy to compare the lease area values.

The first map shows a section that contains streams in it. The streams extend beyond this section but have been condensed down. The second map shows a selected section that is ready for data analysis. This map shows a section of Goshawk nests.

Week 8 = 10/12/07 = Chapter 10 Maps


This map shows a selection of neighborhoods that contain a shopping center in them.


This map shows a commerical zoned area that contains a shopping center. Of course the area is zoomed in to better show the shopping area.

Week 8 = 10/12/07

Today in class we had our second test for the semester. Since I took the first test kinda late, I haven't recieved my grade from the first test when I took the second test. Maybe next class I can get my grades from both tests. In addition to the test we also looked at chapter nine powerpoint. Mr. Kennedy did something kinda different for the powerpoint. He displayed the powerpoint on the projector as well as on all the lab computers. He did this to better show the maps that were in the powerpoint. After the powerpoint we did chapters ten, eleven, and twelve in the GTKA for lab. I now have gotten in the habit of saving the maps as jpegs so I can post them on this blog site. It is going to take about another week to get all the images from the past chapters on the site. Displaying above the blog should be the maps from chapters ten and eleven. The maps for twelve are going to be added to that in about three days.

Thursday, October 11, 2007

Week 7 = 10/05/07

Today in class we looked at attribute data and tables. Yes, today I was not in class due to my own fault. What can I say but I overslept and missed the entire class. I kinda wish I hadn't missed this class due to the announcement of a test next class period. The test will cover chapters 4,6,7, and 8. Assigned was also 7A, 7B, 8, and 9 lab exercises in the GIS book. At least I think that 7A and 7B were assigned. Needless to say that I am going to be doing alot of lab work Thursday afternoon and night to prep for this test. About three posts up from this one should be some maps and tables for chapter eight and nine. Chapter seven maps are coming soon.

Friday, September 28, 2007

Week 6 = 09/28/07

Today in class was went off the schedule and did something different. Here is the rundown of what happened. More information was given about the GIS that AB Tech is hosting in November. Also we looked at chapter six, aerial and satellite images. The powerpoint for this chapter had alot of aerial and satellite images in it. Due to the projector in the class, we weren't able to see the images all that good. I might have to take a look at some of those images on my computer. After looking at the chapter we did a lab that the instructor has created to test our knowledge of what we have learned so far. The exercise is on the GIS blog site. The exercise allowed us to take a map of the Bent Creek area and georeference the data. Within the exercise is two fifteen minutes videos, made by the instructor, showing how to do the entire exercise. The instructor wanted the exercise not to take to long and for us not to have homework. What really happened is that me and some other classmates were having trouble with the exercise, so we have been instructed to finish it on our own time before next class. One of the issues that I was having is actually something that is very easy to remember. The rule is always "unknown to known." What really happened when I did the lab was putting known to unknown. When I did this the map started getting alittle funky. After thirty minutes of doing this, I finally fixed the issue and put "unknown to known" with the instructor's help. Hopefully by next class I will have that drilled into my head that you should always put "unknown to known."

Friday, September 21, 2007

Week 5 = 09/21/07

Today in class we went over chapter four (data entry and data sources) and chapter seven (digital data). The lecture took about two and a half hours to complete due to the amount of data in each chapter. Of course there was breaks added into the lecture for us to stretch our legs and get some water. The labs we did were chapter fiftteen and chapter sixteen in the GTKA book. During lab time, the instructor announced that on November ninth AB Tech is going to have a GIS day. That is the day that all the GIS "big wigs" from the city are going to meet on the campus and have displays, geo type domes, and demos that we can destory (test). The "event" is going to be from 9am - 2pm. Since this is in our class time, our class is going to be run crowd control (I should bring my pepper spray and nightstick), having class time, and looking at all the "owe....awe" displays. I wonder how much stuff they will actually trust me to handle?

Thursday, September 20, 2007

Week 4 = 09/14/07

Today was our first test for the GIS class. Due to a series of events that happened this morning, I was unable to attend the test. Since we only have four test this entire semester, I either have to make up the test and receive a lower grade for turning it in late or take a zero on the test and get hundreds on the next three tests. I can decide what I would like to do but when it comes down to it, the instructor has the final say.

Thursday, September 13, 2007

Chapter 3B Map

This map shows two distinct lines. The top line shows a planned flight plan and the bottom line shows the actual flight plan. Pop Quiz Hot Shot, One of these lines has a image of something at the end of it. Can you tell me what that image is and which line has it?

Chapter 3A Map


During the semester, I will be posting images of some maps for the ArcGIS lab book. This image is from exercise 3A step number twenty. To be honest, I think this is the overview of a flight plan that someone had took.


Friday, September 7, 2007

Week 3 = 09/07/07

Today in class we discussed chapter 3, projections and coordinate systems, in the GISF book. The powerpoint for the chapter is, to say the least, rather long. For the lab we did chapter 13 in the GTKA book. The plan was to do the ESRI 'live' Training Seminar, on the GIS blog site, but due to time issues that seminar is assigned for homework. The announcement was made that there is going to be a test next class period on chapters one thru three. About five blogs and six maps up from this blog are the maps for chapter 13 in the GTKA book. I finally was able to to get around to exporting the map from ArcMap into a jpeg file. Even though this blog was created on 09/07/07 I wasn't able to upload the images until Friday, 10/19/07. That is alittle over a month to have the images uploaded. I have got to get these images uploaded that day the labs are assigned if not the day after.

Week 2 = 08/31/07

Today in class we discussed the different types of data modules. We also did chapter 4 and chapter 14 labs in the GTKA book.

Friday, August 31, 2007

Week 1 = 08/24/07

Today in class we went over chapter one and chapter 2. We discussed the syllabus as well as the website for the class. Now I am going by what the schedule says on this due to the fact that I was not in class today.