
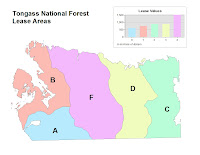
The tan colored map shows a section that has been aggregated into five lease polygons and the letter map makes it easy to compare the lease area values.


The first map shows a section that contains streams in it. The streams extend beyond this section but have been condensed down. The second map shows a selected section that is ready for data analysis. This map shows a section of Goshawk nests.
No comments:
Post a Comment