Friday, October 19, 2007

Week 3 = 09/07/07 = Chapter 13 Maps


This map shows three different projected coordinate systems. All of the data frames are using the Albers Equal Area Conci projection but each data frame has a different coordinate system that defines it. This small of a map might be hard to read. If it is then click on the image itself to kinda get a better view. If you would like me to make the image bigger then post a comment about it and I will see what I can do.

This map shows which states have had the most growth between 1990 and 2000. It is kinda hard to see this map. I think if you click on the image itself it will display the map be itself and you might could see it better. If not, then post a comment about it and I will see what I can do.

Thursday, October 18, 2007

Week 7 = 10/05/07 = Chapter 9 Maps & Tables


This map shows a selection of metals pits that are most hazardous and the type of clean up for the pits. The different colored dots indicate the type of clean up. To be honest, I have no idea what type of clean up the colors mean. When I was exporting this image I forgot to make a image that defines what the colors stand for. For anyone looking at this map and want to know what the colors mean then post a comment on here and I will see what I can do.

This map shows a map that has three selected abandoned pits that are within a half mile of the Mississippi River. All three selected pits have had there tables appended to make one table or report for them.

Week 7 = 10/05/07 = Chapter 8 Maps & Tables


This map shows a selected parcel that is up for sale from about two dozen or more parcels. The table to the right of the map shows the attributes (asking price, zip code, address, etc..). If you are having trouble making out any of the maps, then post a comment on the blog and I will see what I can do.

The map of the left shows a group of parcels that are up for sale and that have a asking sale price of less than one hundred-seventy thousand. The table to the right of the map shows the attributes for the selected parcels in the map.

This report displays the sale price, how many square feet, and how many bedrooms each parcel has that is up for sale. I wonder if the company that owns them are able to do a monthly payment plan.

Friday, October 12, 2007

Week 8 = 10/12/07 = Chapter 11 Maps


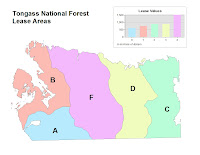
The tan colored map shows a section that has been aggregated into five lease polygons and the letter map makes it easy to compare the lease area values.

The first map shows a section that contains streams in it. The streams extend beyond this section but have been condensed down. The second map shows a selected section that is ready for data analysis. This map shows a section of Goshawk nests.

Week 8 = 10/12/07 = Chapter 10 Maps


This map shows a selection of neighborhoods that contain a shopping center in them.


This map shows a commerical zoned area that contains a shopping center. Of course the area is zoomed in to better show the shopping area.

Week 8 = 10/12/07

Today in class we had our second test for the semester. Since I took the first test kinda late, I haven't recieved my grade from the first test when I took the second test. Maybe next class I can get my grades from both tests. In addition to the test we also looked at chapter nine powerpoint. Mr. Kennedy did something kinda different for the powerpoint. He displayed the powerpoint on the projector as well as on all the lab computers. He did this to better show the maps that were in the powerpoint. After the powerpoint we did chapters ten, eleven, and twelve in the GTKA for lab. I now have gotten in the habit of saving the maps as jpegs so I can post them on this blog site. It is going to take about another week to get all the images from the past chapters on the site. Displaying above the blog should be the maps from chapters ten and eleven. The maps for twelve are going to be added to that in about three days.

Thursday, October 11, 2007

Week 7 = 10/05/07

Today in class we looked at attribute data and tables. Yes, today I was not in class due to my own fault. What can I say but I overslept and missed the entire class. I kinda wish I hadn't missed this class due to the announcement of a test next class period. The test will cover chapters 4,6,7, and 8. Assigned was also 7A, 7B, 8, and 9 lab exercises in the GIS book. At least I think that 7A and 7B were assigned. Needless to say that I am going to be doing alot of lab work Thursday afternoon and night to prep for this test. About three posts up from this one should be some maps and tables for chapter eight and nine. Chapter seven maps are coming soon.